Saturday, November 9, 2013

Logging Level OBIEE 11g

Hello All,

Today will discuss about the log level in OBIEE.

The log level is most useful part is the information it can provide about the actions performed by the users, the logical sql that it generates, whether the data was returned from a cache hit, or if it had to get it from the database.
OBIEE creates a log file called NQQuery.log which records valuable information about the operations performed by the OBIEE server.

The log file is created by default in the C:\OBIEE\instances\instance1\diagnostics\logs\OracleBIServerComponent\coreapplication_obis1 directory.
The default maximum size of this file is 10Mb. OBIEE does limited log rotation. After the log fills up, it copies it over to NQQuery.log.old and then reuses the log file.

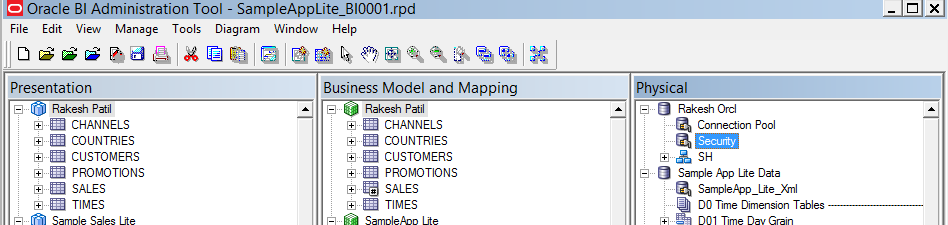
Set logging level in Obiee 11g:

Open Administration tool, File > 
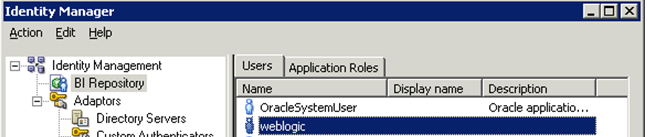
Open > Online > Manage > Identity 

If you’re not able to see the "user" Please refer below link. or In Search type "Users Name not showing in RPD"

Double Click on Web-logic.


  I have set the logging level 2.
  Click on “ok”save the RPD and Create the Sample report and check the log into the NQQuary.log File
  
Sample Screen : Shots


Monday, October 14, 2013

Authentication - External Database Table

Hello All,

This info I got from the wordspress blog. I tried “External table Authentication” on my own machine and it was working fine for me.  1st of all we should know what is authentication.

What is mean by Authentication?

Authentication is the process in which a user id and password is verified to see if the user is a valid user.

Instead of creating user IDs and passwords manually in an Oracle BI repository (10g) and Console (11g), you can maintain lists of users and their passwords in an external database table and use this table for authentication purposes.

Type of Authentication:

External table authentication, Database Authentication, LDAP authentication, Oracle BI Server User Authentication

External table Authentication Steps:

Please copy below code and create the table. In case if you’re not able to copy, Please drop me massage.

CREATE TABLE “SECURITYTABLE”
(    ”ID” NUMBER,
“GRP” VARCHAR2(20),
“PWD” VARCHAR2(20),
“SALESREP” VARCHAR2(20),
“USERNAME” VARCHAR2(20)
) ;

Insert into SECURITYTABLE
(ID,GRP,PWD,SALESREP,USERNAME) values (1,’SalesAdmin’,'az’,'ALAN ZIFF’,'AZIFF’);
Insert into SECURITYTABLE
(ID,GRP,PWD,SALESREP,USERNAME) values (2,’SalesAdmin’,'at’,'ANDREW TAYLOR’,'ATAYLOR’);
Insert into SECURITYTABLE
(ID,GRP,PWD,SALESREP,USERNAME) values (3,’SalesRep’,'aj’,'ANN JOHNSON’,'AJOHNSON’);
Insert into SECURITYTABLE
(ID,GRP,PWD,SALESREP,USERNAME) values (4,’SalesRep’,'bj’,'ANNE WILLIAMS’,'AWILLIAMS’);
Insert into SECURITYTABLE
(ID,GRP,PWD,SALESREP,USERNAME) values (5,’SalesRep’,'bn’,'BETTY NEWER’,'BNEWER’);
Insert into SECURITYTABLE
(ID,GRP,PWD,SALESREP,USERNAME) values (6,’SalesRep’,'cd’,'CHRIS DREW’,'CDREW’);
Insert into SECURITYTABLE
(ID,GRP,PWD,SALESREP,USERNAME) values (7,’SalesRep’,'cm’,'CHRIS MUIR’,'CMUIR’);
Insert into SECURITYTABLE
(ID,GRP,PWD,SALESREP,USERNAME) values (8,’SalesRep’,'da’,'DALE AREND’,'DAREND’);
Insert into SECURITYTABLE
(ID,GRP,PWD,SALESREP,USERNAME) values (9,’SalesRep’,'df’,'DALE FAIRWEATHER’,'DFAIRWEATHER’);
Insert into SECURITYTABLE
(ID,GRP,PWD,SALESREP,USERNAME) values (10,’SalesRep’,'ds’,'DICK SCHMIDT’,'DSCHMIDT’);

Confirm table is created properly.

Open the “Oracle BI Administration Tool” and “Open Current live RPD in offline mode”


Right click the “Rakesh ORCL” connection in the “Physical” layer pane and select “New Object” -> “Connection Pool…”

Enter “SECURITY” for the “Name:” field. And Select “OCI 10g/11g″ for the “Call interface:”

Select “ORCL” for the “Data source name:’’ and Enter shared logon user name and password. Check the below details. Then click the “OK” button.

Right Click the “SECURITY” connection pool in the “Physical” layer pane and select “Import Metadata”. Check your data source name “ORCL” and enter the SH for both the “User Name:” and “Password:” fields, then click the “Next” button.

Click “Next” button with below checkboxes select as show in screenshot                                           


Select the SECURITYTABLE and click on > as shown below, then click “Finish” button


Now you should be able to see “SECURITYTABLE” in the “Physical” layer pane as shown below:

Right Click on the “SECURITYTABLE” and select “View Data…”.

Select Connection Pool you want to use for database ORCL” window, select “SECURITY” then click on “Select” button.


Go to Administration Tool Menu select “Manage” -> “Variables…”


On the “Session Variable Initialization Block” window click the “Edit Data Source…” button.

In the “Session Variable Initialization Block Data Source” window select “Database” for the “Data Source Type:” field

Select the “Default initialization string” button and enter the below SQL:

SELECT GRP, SALESREP, USERNAME, 2 FROM SECURITYTABLE WHERE USERNAME = ':USER' AND PWD = ':PASSWORD'

Click the “Browse…” button and in the “Select Connection Pool” window select “SECURITY” the click the “Select” button as show below:


Then click “OK” button to close the “Session Variable Initialization Block Data Source” window.

In the “Variable Target” section click on the Edit Data Target

In the “Session Variable Initialization Block Variable Target” window click on “New…” button.

In the “Session Variable” window enter “GROUP” for “Name:” field and click on the “OK” button

Click “Yes” on the Warning pop-up window.

Similarly create all 4 Session Variables: GROUP, DISPLAYNAME, USER and LOGLEVEL as show below and Click on the “OK” button to close the window.

Finally on the “Session Variable Initialization Block” window enter “Security” for the “Name:” field.

Make sure “Required for authentication” check box is NOT Selected.

Verify entries as in below screenshot and Click “OK” button.

Now go to the URL: http://rakesh:7001/analytics and login with the admin user “weblogic” .

Go to “Administration” on the top menu and under “Security” section select “Manage Catalog Groups”

Click the “+” icon with “Create a new catalog group” tooltip.

On the “Add Group” window enter “SalesAdmin” for the “Catalog Group Name *” and click on the “OK” button.

Create another catalog group with the same procedure above: “SalesRep”.

IMP Notes – Catalog Group name should be same which available in SECURITYTABLE


After Creating catalog group (Sales Admin and Salesrep) create the sample report and give it access to as SalesAdmin and SalesRep.

Login  with SalesAdmin and SalesRep Group User. After logging you will see they access only for report

Example –

Here I have l logged in with user ANNJOHNSON, Here you will see he has access only QuickStart  - Overview Dashbored.  He don’t have access for OBIEE Analysis.

If you have any question, Please let me know.

Thanks

Rakesh Patil

Wednesday, October 9, 2013

Show a Home page inside Dashboard or Access OBIEE Home page from dashboard.

Hello All,

There is something new and very simple I found today which I thought to share with you.

Scenario:  How you will implement if user said he want a Home page inside Dashboard or Access the Home page from dashboard.

Solution:
Open you’re home page and copy the URL of home page..


I have dashboards i.e “ Rakesh Patil - OBIEE Dev -Show a Home page inside Dashboard " I want to display Home page of obiee into dashbored (Rakesh Patil - OBIEE Dev -Show a Home page inside Dashboard)


Click on the Edit Dashboard and Add the Embedded content objee.
       Click on the edit properties of the embedded content and Now paste the URL of home page into properties and change the width and height into 1500px .Save Dashboard


       Below you will see the Home page inside Dashboard. Here you can create report, you can access  Subject  area, Agent, Presentation catalog..etc


    You can see Presentation catalog


  You can access subject area.
 
-Thanks and Regards
-Rakesh Patil 


Monday, September 23, 2013

How to “Return to previous screen From Target Page

Hello All,

Today will discuss a simple thing which so many reporting people don’t know how to “Return to previous screen from target page”

Check the below screen, if I will click on “Return to previous screen” It should go to “Home page of OBIEE”

You can set any thing as ‘’Return to previous screen” for example Report, Dashboard, Agent, KPL or any browser link. Here I have taken home page of OBIEE as “Return to previous screen”.


Steps:
1: Go to Target page - Dashboard and click on edit dashboard

2: Drag the Text object from dashboard object.
3: Go to Text object properties and check the “Contain HTML Markup”
4: Put the below HTML code and in href give it your OBIEE home page path. Save the dashboard
            <div>
<a href=http://obi.rakeshpatil.net/analytics/saw.dll?bieehome>
Returns to Previous Screen
</a>
</div>
5: Save the dashboard and click on “Return to Pervious screen”. Once you click on “Return on Pervious Screen” Home page of OIBEE came from target page.

If you have any question, Please don’t hesitate to contact me.

-Rakesh Patil

Wednesday, August 28, 2013

Master-Detail linking - OBIEE 11g

Master-Detail linking new features included in OBIEE 11g. It was not in 10g.

Master-detail linking of views allows you to establish a relationship between two or more views such that one view, called the master view, will drive data changes in one or more other views, called detail views


Assume that we have three views; one view which shows “Contact Num count –Rakesh Patil” by Quarterly lines while the other two graph view that shows “Contact Num count –Rakesh” by months with prompt quarter. Link these three views so that when you click on particular quarter, month in the graph changes to as per selected quarter 

Create the simple report.


Click on “Contac Num Cout –Rakesh Pati”.Go to Column Properties and click on interaction and Go to ‘Interaction Tab –>Primary Interaction –> Send Master Detail Events àEnter the channel name , I have given “RA01”


Click on results and create a Graph view à.Edit the Graph view ,click on Graph properties –> Enter the Channel name that we specified in Master Report –i.e. “RA01”


Save the report and click on quarter. Once you click on quarter you will see the both graph will show the month as per the selected graph.


I hope you will understand..:)

Regards 
Rakesh Patil